In the era of data-driven investing, investors face massive streams of price series, financial report figures and macro indicators every day. Yet for most people, the first hurdle to truly understanding data is often not mathematics, but

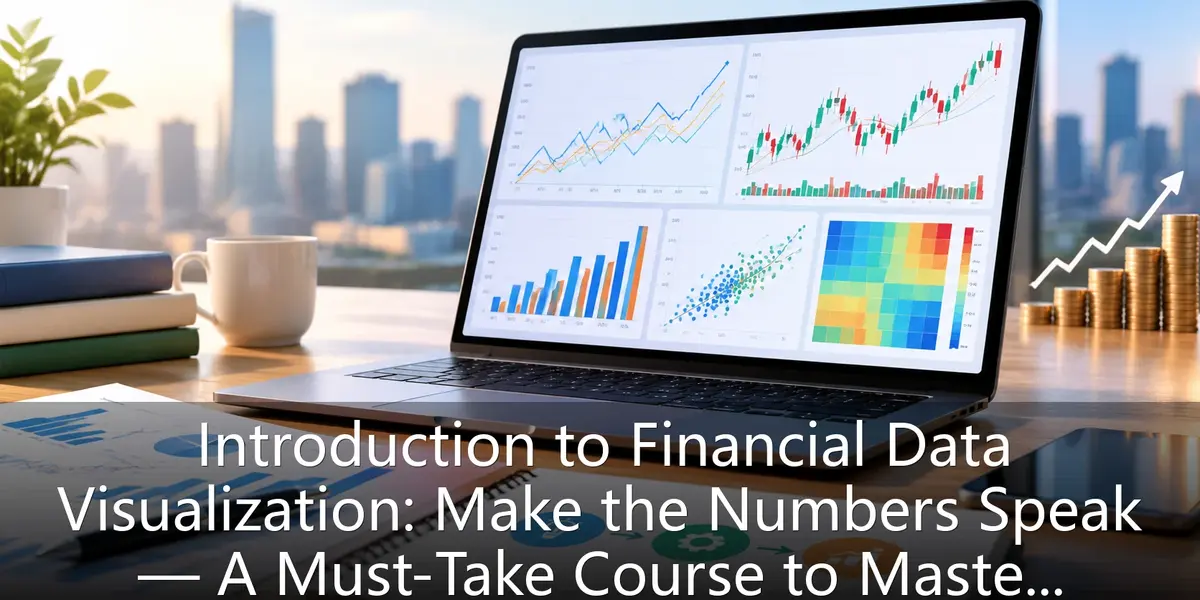
In the data-driven investing era, financial data visualization is essential for novice investors. This article explains how to read line, bar, candlestick, scatter and heat maps, dissects five common pitfalls like truncated axes and cherry-picked time windows, and offers a three-step workflow—defining questions, picking tools, building a chart-review habit—to help beginners turn abstract numbers into clear investment insights and lay the first cornerstone of data-driven investing.
In the era of data-driven investing, investors face massive streams of price series, financial report figures and macro indicators every day. Yet for most people, the first hurdle to truly understanding data is often not mathematics, but



